With the exit of thermal coal from generation of electricity means coal to mines to reduce 80 percent within a decade. Check out renewable energy by 2025 to see the rapid increase in renewable energy.
The Global Coal Mine Tracker in March 2022, is a worldwide dataset of coal mines and proposed projects producing over 1m tonnes per year. The tracker provides asset-level details on ownership structure, development stage and status, coal type, production, workforce size, reserves and resources, methane emissions, geolocation, and over 30 other categories.
Shipping Demand will Plummet with Mine Closures
Approximately 50% of shipping is coal and fossil fuel methane. Reduction of coal mines will make a huge impact in shipping.
Countries Impacted if mines to reduce by 80 percent
The top 16 countries with more than 10 mines, each bigger than 1 million tonnes shows 2200 mines out of the 2312 identified are in these 16 countries. These are a mix of both thermal and coking coal, and many predict coking coal will be needed for decades more. That is not an assured assumption.
| Top Countries with More than 10 Mines | Number Of Operating Mines |
|---|---|
| China | 970 |
| India | 404 |
| United States | 251 |
| Russia | 131 |
| Indonesia | 107 |
| Australia | 95 |
| South Africa | 70 |
| Turkey | 37 |
| Poland | 24 |
| Kazakhstan | 18 |
| Mongolia | 16 |
| Vietnam | 16 |
| Canada | 15 |
| Bosnia and Herzegovina | 12 |
| Germany | 10 |
| North Korea | 10 |
Data from Global Energy Monitor
https://globalenergymonitor.org/projects/global-coal-mine-tracker/summary-tables/
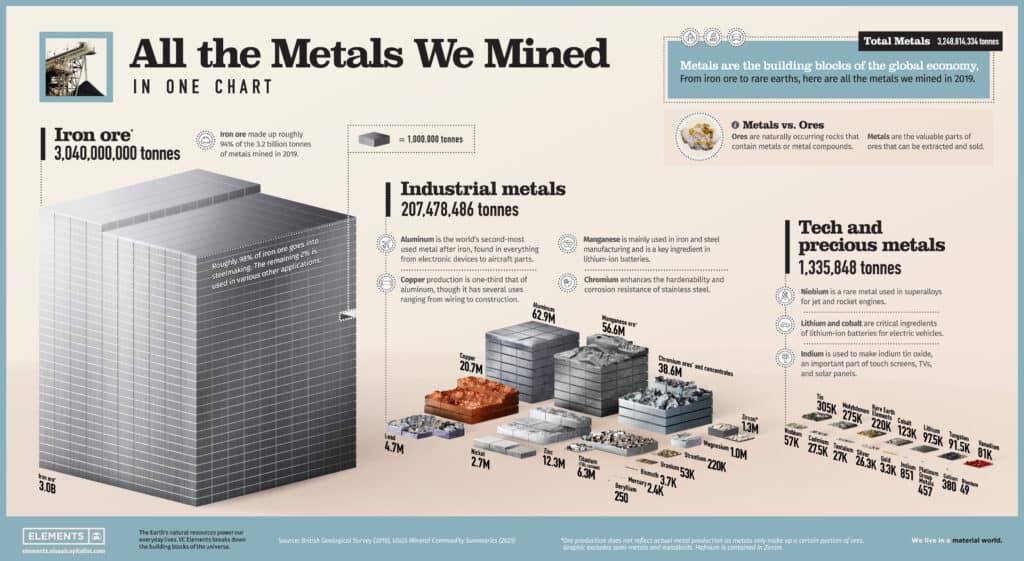
Biggest Miners in the World
Note that “mineral fuels” make up 80% of mines. Iron is large in China and Australia, are limited

Iron Ore Is the Major Ferrous and Non Ferrous mines


Iron Ore by Country
| Ranking | Country | Million tonnes | Percentage of total |
|---|---|---|---|
| 1 | Australia | 900 | 37.6% |
| 2 | Brazil | 400 | 16.7% |
| 3 | China | 340 | 14.2% |
| 4 | India | 230 | 9.6% |
| 5 | Russia | 95 | 4.0% |
| 6 | South Africa | 71 | 3.0% |
| 7 | Ukraine | 62 | 2.6% |
| 8 | Canada | 52 | 2.2% |
| 9 | United States | 37 | 1.5% |
| 10 | Sweden | 35 | 1.5% |
| – | Other countries | 172 | 7.1% |
| Total | 2,394 | 100.0% |
https://www.nrcan.gc.ca/our-natural-resources/minerals-mining/minerals-metals-facts/iron-ore-facts/20517


World Banks Response in 2017
As the world transitions away from coal, the challenges associated with closing mines and their associated thermal power plants, along with regenerating coal-dependent communities, continues to slow the rate at which this transition can take place. To overcome these barriers and assist governments in preparing and planning for a managed transition out of coal, we analyzed in 2017 11 World Bank lending operations on coal sector adjustment from the early 1990s to early 2000s, alongside 5 other country-level coal transitions, to arrive at 9 major lessons for contemporary energy transition in coal regions. These lessons and the analysis underpinning them can be found in the report entitled “Managing Coal Mine Closure: A Just Transition for All.” The lessons formed the basis of a subsequent Coal Sector Transition Assessment Framework, developed by the team in 2018, which guides our current dialogue and operations on coal transition with government clients around the world.
https://www.worldbank.org/en/results/2020/11/10/coal-mine-closure-and-a-just-transition-for-all
Key Points


