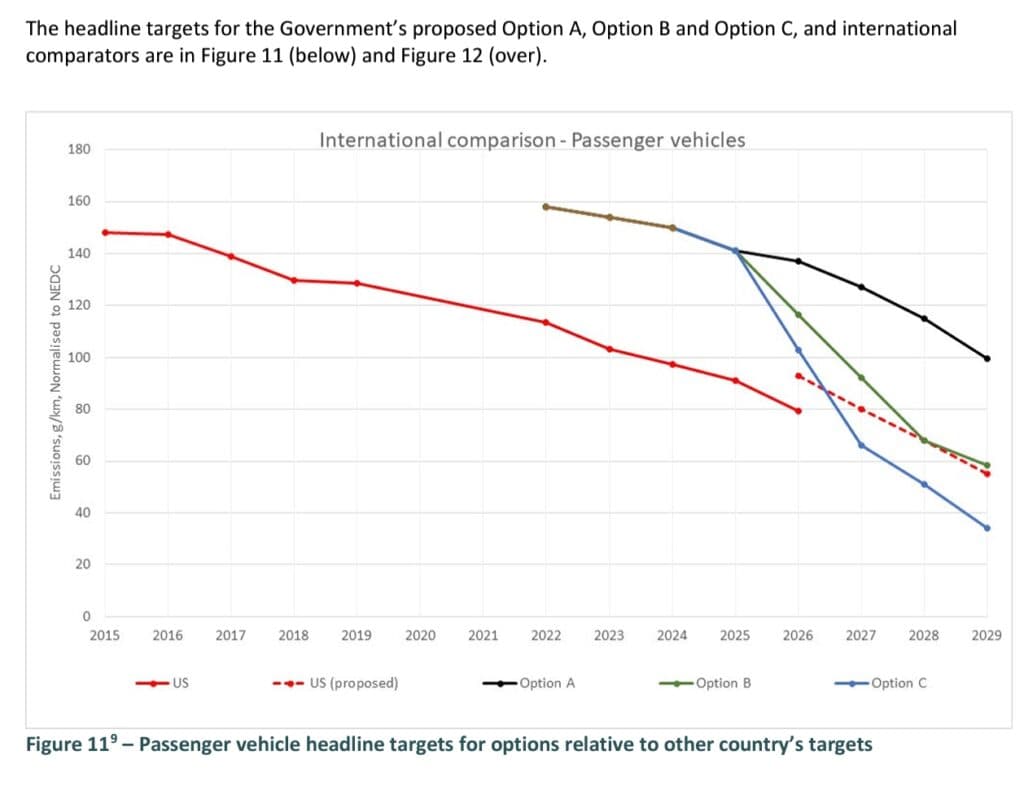
The Australian Government released the background briefing paper – Cleaner, Cheaper Cars to Run – New Vehicle Efficiency Standard for Australia in January 2024 and plan to enact legislation in 2024. Download the full paper here. The Govt Infrastructure Dept came up with 3 scenarios and ask interested parties to provide submissions by early March 2024. Supposedly the preferred legislation will be completed in 2024.
These 3 scenarios are business as usual, moderate introduction of international standards and fast adoption. Option 2 and 3 is to raise vehicle emissions to that of the USA. Only Australia and Russia have low or no regulation.
Transport in Australia contributes about 20% to emissions. Electrifying the fleet, and implementing new vehicle emissions standards all contribute to lowering emissions.

3 Options for Fuel Savings and Emissions Reduction
Option 2 would bring Australia into the USA regulations by 2029 and fast option 3 by 2027


Other Data from Publication
New Vehicle Sales
| New Vehicles 2023 | Number | Percentage |
|---|---|---|
| Passenger vehicles (including most SUVs) | 890,823 | 76.46% |
| Light commercial vehicles (including some utes and vans | 274,185 | 23.54% |
| Total | 1,165,008 | 100% |
Australia’s vehicle fleet (2022)
- Total Fleet
- 19.9 million light vehicles
- 20.7 million vehicles including heavy vehicles and motorcycles
- Average vehicle age
- 10.7 years for passenger vehicles
- 11.1 years for light commercial vehicles
- Average price of a car
- $40,916 (purchase price)
- $50,161 (transaction cost – includes dealer-delivery fees, factory-fitted options and dealer-fitted accessories)
Changes in Car Parc
| Year | 2017 | 2018 | 2019 | 2020 | 2021 | 2022 | 2023 |
|---|---|---|---|---|---|---|---|
| Passenger Cars | 449,987 | 378,470 | 315,932 | 221,103 | 221,556 | 203,056 | 211,361 |
| SUVs | 465,672 | 495,243 | 483,331 | 454,701 | 531,700 | 576,632 | 679,462 |
| LCV (Light Commerical Vehicles) | 236,608 | 237,972 | 225,635 | 205,597 | 253,254 | 256,382 | 274,185 |
| Total | 1,152,267 | 1,111,685 | 1,024,898 | 881,401 | 1,006,510 | 1,036,070 | 1,165,008 |
| Population | 25.244 | 25.52 | 25.807 | 26.059 | 25.921 | 26.177 | 26.639 |
| Cars per capita | 4.56% | 4.36% | 3.97% | 3.38% | 3.88% | 3.96% | 4.37% |
| Households (m) | 8.4 | 8.6 | 8.8 | 8.9 | 9.275 | 9.5 | 9.7 |
| New cars per household | 13.72% | 12.93% | 11.65% | 9.90% | 10.85% | 10.91% | 12.01% |
Total light vehicles: 16.2 million
Passenger Vehicles (PVs): 78% (12.7 million)
Light Commercial Vehicles (LCVs): 17% (2.7 million)


